Graph the linear function by plotting the x- and y-intercepts.
-
A) 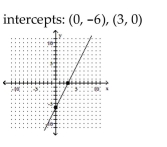
B) 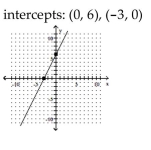
C) 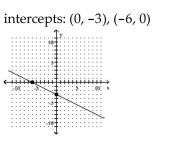
D) 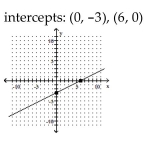
Correct Answer:
Verified
Q57: Determine whether the graph illustrated represents a
Q58: Evaluate the function for the indicated value.
-
Q59: The graph below shows the percentage of
Q60: Determine whether the graph illustrated represents a
Q61: The graph below shows the percentage of
Q63: Graph the linear function by plotting the
Q64: Graph the linear function by plotting the
Q65: Graph the equation. Q66: The graph below shows the percentage of Q67: Write the equation in standard form.
-![]()
-y =
Unlock this Answer For Free Now!
View this answer and more for free by performing one of the following actions

Scan the QR code to install the App and get 2 free unlocks

Unlock quizzes for free by uploading documents