Solve the problem.
-The following bar graph shows the average annual income for single mothers. 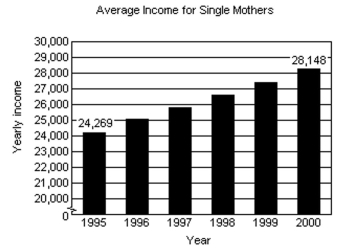 i) Determine a linear function that can be used to estimate the average yearly income for single mothers from 1995 through 2000. Let t represent the number of years from 1995. (In other words, 1995 corresponds to t = 0, 1996
Corresponds to t = 1, and so on.)
Ii) Using the function from part i, determine the average yearly income for single mothers in 1996.
Iii) Assuming this trend continues, determine the average yearly income for single mothers in 2010.
Iv) Assuming this trend continues, in which year will the average yearly income for single mothers reach $31,000?
A) 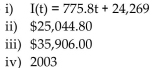
B) 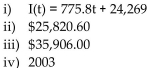
C) 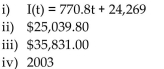
D) 
Correct Answer:
Verified
Q89: Solve the problem.
-The average value , V,
Q90: Solve the problem.
-The gas mileage, m, of
Q91: Solve the problem.
-A vendor has learned that,
Q92: Solve the problem.
-If a line passes through
Q93: Find the equation of a line with
Q95: Solve the problem.
-The cost C, in dollars,
Q96: Solve the problem.
-A truck rental company rents
Q97: Solve the problem.
-In 1995, the average annual
Q98: Solve the problem.
-Linda needs to have her
Q99: Find the equation of a line with
Unlock this Answer For Free Now!
View this answer and more for free by performing one of the following actions

Scan the QR code to install the App and get 2 free unlocks

Unlock quizzes for free by uploading documents