Solve the problem.
-The following graph shows the private, public and total national school enrollment for students for select years from 1970 through 2000. 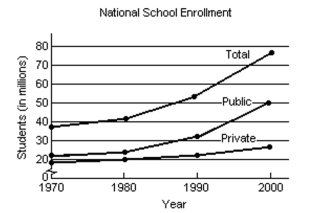 i) How is the graph for total school enrollment, T, determined from the graph of the private enrollment, r, and the
Public enrollment, u?
Ii) During which 10-year period did the total number of students enrolled increase the least?
Iii) During which 10-year period did the total number of students enrolled increase the most?
A) 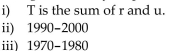
B) 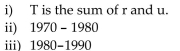
C) 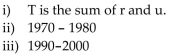
D) 
Correct Answer:
Verified
Q107: Determine whether the two given lines are
Q108: Find the equation of a line with
Q109: Determine whether the two given lines are
Q110: Solve the problem. Q111: Use the graph to find the value.
-![]()
Unlock this Answer For Free Now!
View this answer and more for free by performing one of the following actions

Scan the QR code to install the App and get 2 free unlocks

Unlock quizzes for free by uploading documents