Solve the problem.
-The circle graph below shows the results of the student council presidential election. 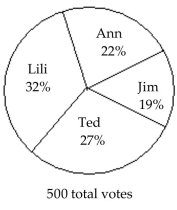 The circle graph shows what percent of the vote each person received. How many people voted for someone other than Ted?
A) 405
B) 135
C) 365
D) 390
Correct Answer:
Verified
Q24: The bar graph shows the number of
Q25: Solve the problem.
-The scores for a statistics
Q26: Solve the problem.
-Health care issues are receiving
Q27: Solve the problem.
-Elaine and Dan want to
Q28: Solve the problem.
-The following test scores were
Q30: The graph shows the recorded hourly temperatures
Q31: Solve the problem.
-A survey of the 7116
Q32: The bar graph shows the number of
Q33: Solve the problem. Q34: Solve the problem.
-![]()
-In 1984, the average selling
Unlock this Answer For Free Now!
View this answer and more for free by performing one of the following actions

Scan the QR code to install the App and get 2 free unlocks

Unlock quizzes for free by uploading documents