Suppose this diagram illustrates the number of women and Democrats in the U.S. Senate. 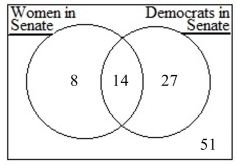 The probability that a senator is either female of Democrat can be calculated as
 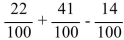 . Describe what the three fractions at the end of this calculation represent in terms
of probability.
Correct Answer:
Verified
View Answer
Unlock this answer now
Get Access to more Verified Answers free of charge
Q95: The bookstore has six red school jerseys,
Q96: The odds against an event are 7:4.
Q97: Every member of Congress declares a single
Q98: The odds in favor of an event
Q99: If the odds against a horse winning
Q101: On a survey at a particular university,
Q102: Four red cards are numbered 1, 2,
Q103: In a shop there are 25 customers,
Q104: Decide if the two events described are
Q105: A card is selected from an ordinary
Unlock this Answer For Free Now!
View this answer and more for free by performing one of the following actions

Scan the QR code to install the App and get 2 free unlocks

Unlock quizzes for free by uploading documents