Given below is the scatter plot of the number of employees and the total revenue ($millions)of 20 U.S.companies.There appears to be a positive relationship between total revenue and the number of employees. 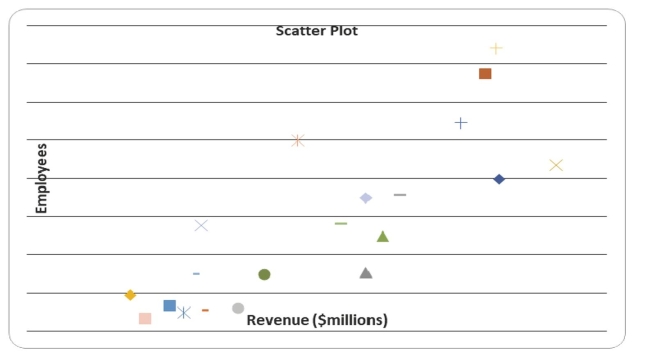
Correct Answer:
Verified
Q165: SCENARIO 2-17
The following table presents total retail
Q173: The addition of visual elements that either
Q181: True or False: The Guidelines for Developing
Q183: True or False: The Guidelines for Developing
Q184: True or False: A multidimensional contingency table
Q186: True or False: The Guidelines for Developing
Q188: True or False: The Guidelines for Developing
Q189: True or False: A multidimensional contingency table
Q203: Given below is the scatter plot of
Q210: Microsoft Excel creates distribution tables using user-defined
Unlock this Answer For Free Now!
View this answer and more for free by performing one of the following actions

Scan the QR code to install the App and get 2 free unlocks

Unlock quizzes for free by uploading documents