Please use the graphs to show what happens to the risk (yield) differential in each situation and why.
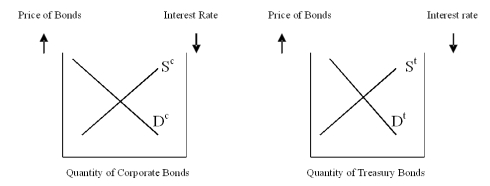
Assume the corporate and Treasury bonds have the same maturity;
a) If the corporate bonds are default-risk free, what could you tell about the price and yields of each?
b) If the corporate bonds are now viewed as having the possibility of default, what happens in each market?
c) If the corporate bonds are granted tax-exempt status, what happens in each market?
d) If the corporate bonds have a longer maturity than the Treasury bonds what would happen?
Correct Answer:
Verified
View Answer
Unlock this answer now
Get Access to more Verified Answers free of charge
Q118: If an investor wants to compare commercial
Q119: What is the effective after-tax yield to
Q120: Assuming the expectations hypothesis is correct, and
Q121: Under the expectations hypothesis of the term
Q122: The paper-bill spread refers to the interest
Q124: Does the expectations hypothesis allow for people
Q125: Why might we expect to see a
Q126: Explain why most retired individuals are not
Q127: We have heard the predictions regarding the
Q128: Suppose that the Federal Reserve is concerned
Unlock this Answer For Free Now!
View this answer and more for free by performing one of the following actions

Scan the QR code to install the App and get 2 free unlocks

Unlock quizzes for free by uploading documents