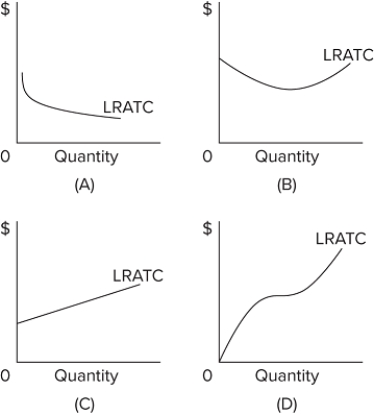
 Refer to the provided graphs. They show the long-run average total cost (LRATC) for a product. For which graph would a firm experience first economies and then diseconomies of scale over its range of output?
A) graph A
B) graph B
C) graph C
D) graph D
Correct Answer:
Verified
Q376: If all resources used in the production
Q377: The table shows three short-run cost schedules
Q378: Suppose a firm is in a range
Q379: The table shows three short-run cost schedules
Q380: If a firm increases all of its
Q382: A firm doubles the quantity of all
Q383: The following schedule gives the cost data
Q384: Plant sizes get larger as you move
Q385: When a firm is experiencing diseconomies of
Q386: When a firm is experiencing economies of
Unlock this Answer For Free Now!
View this answer and more for free by performing one of the following actions

Scan the QR code to install the App and get 2 free unlocks

Unlock quizzes for free by uploading documents