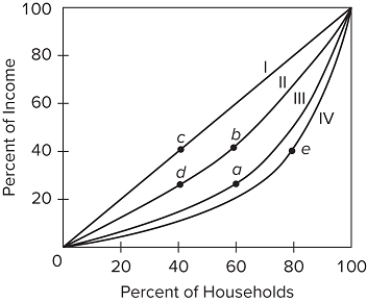
 Refer to the figure, which shows four different Lorenz curves (I, II, III, and IV) . The movement from point b to point a in the graph would indicate that the
A) lower 40 percent of households increased their share of total income from 25 percent to 40 percent.
B) lower 40 percent of households decreased their share of total income from 60 percent to 40 percent.
C) lower 60 percent of households decreased their share of total income from 40 percent to 25 percent.
D) lower 40 percent of households increased their share of total income from 40 percent to 60 percent.
Correct Answer:
Verified
Q225: The wages and salaries that people earn
Q226: Q227: Two major criticisms of the Bureau of Q228: Which of the following would be a Q229: When the distribution of income is adjusted Q231: Earnings received from wealth Q232: Which of the following contributes most to Q233: A cause of the unequal distribution of Q234: The degree of inequality in income distribution Q235: ![]()
A)contribute to income inequality.
B)are![]()
Unlock this Answer For Free Now!
View this answer and more for free by performing one of the following actions

Scan the QR code to install the App and get 2 free unlocks

Unlock quizzes for free by uploading documents