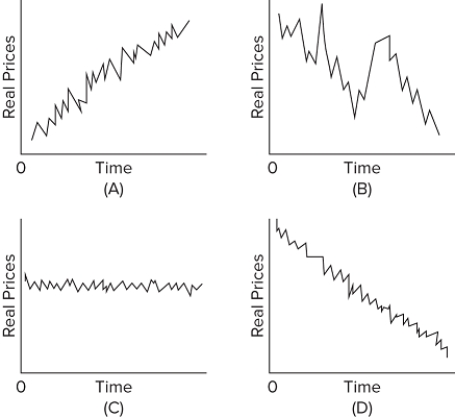
 Which of the diagrams best describes the long-run path of real (inflation-adjusted) farm prices?
A) A
B) B
C) C
D) D
Correct Answer:
Verified
Q63: Measured in terms of farm employment and
Q64: Which of the following best describes the
Q65: Over the past several decades, farm employment
Q66: Which of the following is not characteristic
Q67: A bumper crop of farm products causes
A)only
Q69: An extraordinarily small crop of farm products
Q70: Over time, technological change has
A)reduced both the
Q71: Which of the following is correct?
A)The rapid
Q72: Which of the following countries has the
Q73: In 2017, farm employment constituted about
A)15.8 percent
Unlock this Answer For Free Now!
View this answer and more for free by performing one of the following actions

Scan the QR code to install the App and get 2 free unlocks

Unlock quizzes for free by uploading documents