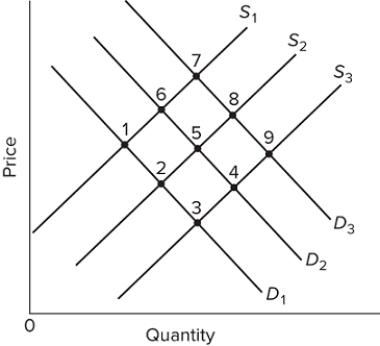
 Refer to the graph of the supply and demand for agricultural products. Which of the following best describes the long-run decline of the U.S. agricultural industry?
A) a shift in supply from S₁ to S₂ and a shift in demand from D₂ to D₁
B) a shift in supply from S₁ to S₃ and a shift in demand from D₁ to D₂
C) a shift in supply from S₃ to S₁ and a shift in demand from D₁ to D₃
D) a shift in supply from S₁ to S₂ and a shift in demand from D₃ to D₁
Correct Answer:
Verified
Q163: Most of the technological advances in U.S.
Q164: Farm employment in the United States amounted
Q165: The amount of capital used per farmworker
Q166: Based on World Bank data for 2015-2018,
Unlock this Answer For Free Now!
View this answer and more for free by performing one of the following actions

Scan the QR code to install the App and get 2 free unlocks

Unlock quizzes for free by uploading documents