Multiple Choice
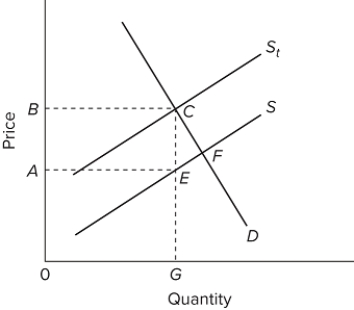 In the figure, S is the before-tax supply curve and Sₜ is the supply curve after an excise tax is imposed. The total tax collection from this excise tax will be area
A) ABCE + ECF.
B) ABCE.
C) ECF.
D) 0 BCG.
Correct Answer:
Verified
Related Questions
Q170: The efficiency loss of a tax is
A)
Q171: (Advanced analysis)The equations for the demand and
Q172: If the demand for a product is
Q173: Q174: (Advanced analysis)The equations for the demand and Q176: (Advanced analysis)The equations for the demand and![]()
Unlock this Answer For Free Now!
View this answer and more for free by performing one of the following actions

Scan the QR code to install the App and get 2 free unlocks

Unlock quizzes for free by uploading documents