Multiple Choice
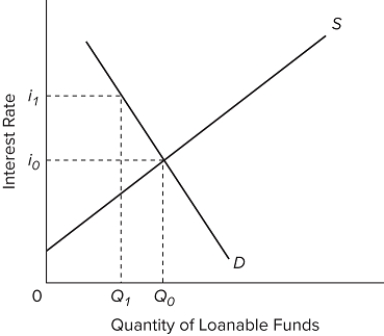 Refer to the market for loanable funds, as shown in the graph. Suppose the market for loanable funds is originally in equilibrium at interest rate i ₀ and quantity Q ₀ . In the next period, the equilibrium interest rate increases to i ₁ and quantity decreases to Q ₁. Which of the following could be the cause of this shift?
A) Households decide to save less.
B) Households decide to save more.
C) Investors become less optimistic.
D) Investors become more optimistic.
Correct Answer:
Verified
Related Questions

