Solve the problem.
-The following graph shows data for a recent train ride from New York to Toronto. Find the rate of change of the distance from New York with respect to time, in miles per hour. 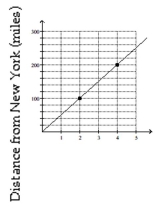 Time of Day (PM)
A) 50 miles per hour
B) 55 miles per hour
C) 100 miles per hour
D) 40 miles per hour
Correct Answer:
Verified
Q102: Find the slope of the line.
-x =
Q103: Find the slope of the line going
Q104: Find the slope of the line.
-3x -
Q105: Solve the problem.
-The value of a particular
Q106: Solve the problem.
-An old house has a
Q108: Solve the problem.
-Over one particular stretch of
Q109: Find the slope of the line.
-3x +
Q110: Solve the problem.
-Data regarding the amount spent
Q111: Solve the problem. Q112: Find the slope of the line.
-![]()
-y =
Unlock this Answer For Free Now!
View this answer and more for free by performing one of the following actions

Scan the QR code to install the App and get 2 free unlocks

Unlock quizzes for free by uploading documents