FIGURE 8-1
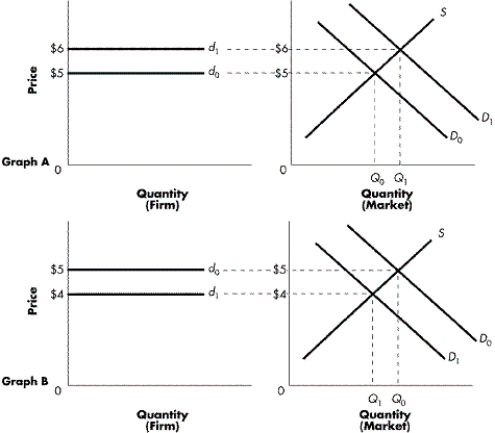
-Refer to Figure 8-1. In Graph B, what is the result of the market demand decreasing from D₀ to D₁?
A) Both the market price and the price of the price-taking firm have increased to $5.
B) At the new equilibrium price, the firm will be unable to sell any of its output.
C) Both the market price and the price of the price-taking firm have fallen to $4.
D) The quantity of goods transacted in the market has fallen from Q1 to Q0.
Correct Answer:
Verified
Q24: Why does a perfectly competitive firm NOT
Q25: Farmer Brady sells wheat in a market
Q26: FIGURE 8-2 Q27: A firm sells apples in a perfectly Q28: What is marginal revenue for a perfectly Q30: What will occur if a price-taking firm Q31: FIGURE 8-2 Q32: Which of the following describes the horizontal Q33: How will a profit-maximizing firm in a Q34: FIGURE 8-1 Unlock this Answer For Free Now! View this answer and more for free by performing one of the following actions Scan the QR code to install the App and get 2 free unlocks Unlock quizzes for free by uploading documents
![]()
![]()
![]()

