FIGURE 11-2
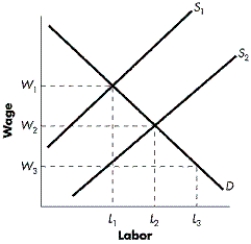
-Refer to Figure 11-2. When unions successfully increase the wages of their members, what happens to the supply curve and workers in the union sector?
A) The curve shifts from S1 to S2 and workers from L2 to L1 lose their jobs.
B) The curve shifts from S2 to S1 and workers from L2 to L1 lose their jobs.
C) The curve shifts from S1 to S2 and workers from L3 to L1 lose their jobs.
D) The curve shifts from S2 to S1 and workers from L3 to L1 lose their jobs.
Correct Answer:
Verified
Q66: Approximately how much higher are wages in
Q67: When are people at their peak in
Q68: Which of the following best describes the
Q69: According to Medoff and Freeman, how might
Q70: Which of the following countries shows the
Q72: Which of the following best describes labour
Q73: If the demand for software engineers increases
Q74: Which province has the highest union rate
Q75: Evidence suggests that share of income has
Q76: What is the most significant factor, enabling
Unlock this Answer For Free Now!
View this answer and more for free by performing one of the following actions

Scan the QR code to install the App and get 2 free unlocks

Unlock quizzes for free by uploading documents