Forty truck buyers were asked to indicate the car dealer they believed offered the best overall service. The four choices were A, B, C, and D as shown below: 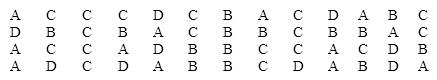 Construct a table showing the frequencies and relative frequencies for this data set. What proportion of car buyers rated dealer D as the best?
Correct Answer:
Verified
Q35: For what type of data is a
Q47: {Teachers Ages Narrative} Draw a frequency histogram
Q164: Suppose you measure the number of minutes
Q166: A supermarket's monthly sales (in thousands of
Q167: Consider the following cumulative frequency distribution.
Q168: Teachers Ages The ages (in years)of a
Q170: Business School Graduates A sample of business
Q172: Insurance Company A representative from a local
Q173: {Business School Graduates Narrative} If you were
Q174: Business School Graduates A sample of business
Unlock this Answer For Free Now!
View this answer and more for free by performing one of the following actions

Scan the QR code to install the App and get 2 free unlocks

Unlock quizzes for free by uploading documents