A supermarket's monthly sales (in thousands of dollars)for the last year were as follows: 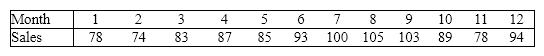 Construct a relative frequency bar chart for this data set. How many observations are there in this data set?
Correct Answer:
Verified
View Answer
Unlock this answer now
Get Access to more Verified Answers free of charge
Q35: For what type of data is a
Q44: {Test Grades Narrative} Construct frequency and relative
Q45: Teachers Ages
The ages (in years)of a
Q47: {Teachers Ages Narrative} Draw a frequency histogram
Q108: NARRBEGIN: Home Care
Home Care
Data are collected on
Q164: Suppose you measure the number of minutes
Q167: Consider the following cumulative frequency distribution.
Q168: Teachers Ages The ages (in years)of a
Q169: Forty truck buyers were asked to indicate
Q170: Business School Graduates A sample of business
Unlock this Answer For Free Now!
View this answer and more for free by performing one of the following actions

Scan the QR code to install the App and get 2 free unlocks

Unlock quizzes for free by uploading documents