Exhibit 2-18 Production possibilities curves 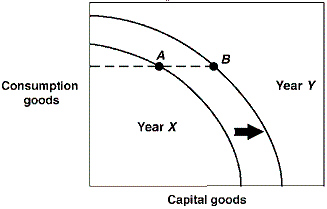 In Exhibit 2-18, the production possibilities curves for a country are shown for the years Year X and Year Y. Suppose this country was located at point A in Year X and point B in Year Y. This country:
A) is producing the same number of capital goods in both years.
B) is producing the same number of consumption goods in both years.
C) has shown no growth between Year X and Year Y.
D) has higher unemployment in Year X than in Year Y.
E) has higher unemployment in Year Y than in Year X.
Correct Answer:
Verified
Q105: A nation can accelerate its economic growth
Q164: What to produce, how to produce, and
Q165: Opportunity cost is the best alternative sacrificed
Q166: Exhibit 2-18 Production possibilities curves 
Q166: The opportunity cost of producing a good
Q169: Exhibit 2-18 Production possibilities curves
Q173: Only socialist economies need to answer the
Q179: An opportunity cost is the highest valued
Q197: The basic approach in marginal analysis is
Q199: Every economic choice has an opportunity cost.
Unlock this Answer For Free Now!
View this answer and more for free by performing one of the following actions

Scan the QR code to install the App and get 2 free unlocks

Unlock quizzes for free by uploading documents