Exhibit 3-13 Supply and demand curves 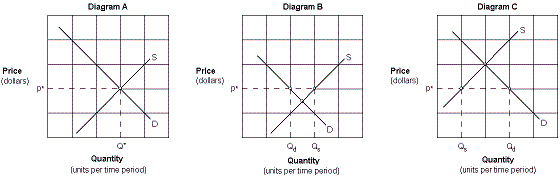 Which of the graphs in Exhibit 3-13 illustrates a surplus exists at the indicated market price?
A) Diagram A.
B) Diagram B.
C) Diagram C.
D) Diagrams A and C.
Correct Answer:
Verified
Q151: The most important characteristic of the equilibrium
Q156: The use of a price system eliminates:
A)
Q250: If the current price of a good
Q258: The equilibrium price is best defined as
Q277: Exhibit 3-7 Demand and supply curves
Q282: Exhibit 3-14 Supply and demand curves
Q283: Exhibit 3-8 Demand and supply data for
Q284: Exhibit 3-14 Supply and demand curves
Q285: Exhibit 3-10 Demand and supply curves
Q286: Exhibit 3-11 Demand and supply curves
Unlock this Answer For Free Now!
View this answer and more for free by performing one of the following actions

Scan the QR code to install the App and get 2 free unlocks

Unlock quizzes for free by uploading documents