Exhibit 4-2 Supply and demand curves 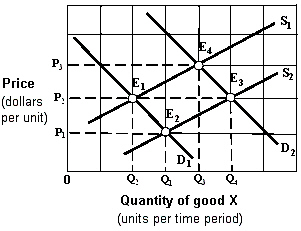 The market shown in Exhibit 4-2 is initially in equilibrium at E3. Changes in market conditions result in a new equilibrium at E4. This change is stated as a(n) :
A) increase in demand and an increase in supply.
B) decrease in demand and a decrease in quantity supplied.
C) increase in quantity demanded and an increase in quantity supplied.
D) decrease in supply and a decrease in quantity demanded.
E) increase in supply and an increase in quantity demanded.
Correct Answer:
Verified
Q21: Exhibit 4-2 Supply and demand curves
Q22: Exhibit 4-2 Supply and demand curves
Q24: Exhibit 4-3 Supply and demand curves
Q25: A hurricane destroyed the peach crop in
Q27: Exhibit 4-2 Supply and demand curves
Q28: Exhibit 4-2 Supply and demand curves
Q29: A technological breakthrough lowers the cost of
Q29: Exhibit 4-1 Supply and demand data
Q31: Exhibit 4-1 Supply and demand data
Q175: Consider the market for grapes. An increase
Unlock this Answer For Free Now!
View this answer and more for free by performing one of the following actions

Scan the QR code to install the App and get 2 free unlocks

Unlock quizzes for free by uploading documents