Figure 20-2
Number of Poor
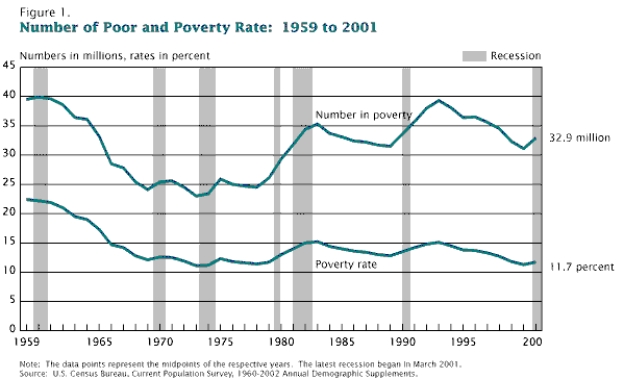
-Refer to Figure 20-2.Between 1959 and 2001 the poverty rate has
A) increased overall.
B) decreased overall.
C) stayed the same overall.
D) moved in the opposite direction of the number of people in poverty.
Correct Answer:
Verified
Q81: The poverty line in the country of
Q82: The poverty line in the country of
Q83: The distribution of income for Abbyville is
Q84: The distribution of income for Inequalia is
Q87: The distribution of income for Grim is
Q88: In 2008,the poverty rate in the United
Q90: Based on U.S.data for 2008,the poverty rate
Unlock this Answer For Free Now!
View this answer and more for free by performing one of the following actions

Scan the QR code to install the App and get 2 free unlocks

Unlock quizzes for free by uploading documents