The figure below shows the supply and demand for bonds for Charter Corp. (SC and DC) and US Treasury Securities (SUS and DUS) . The default risk premium paid by Charter Corp. in this market is represented by 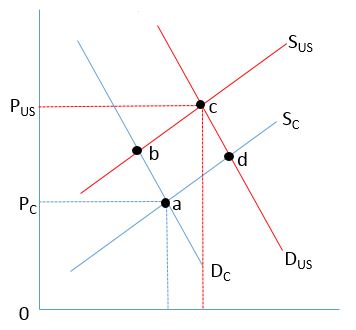
A) PUS0.
B) PC0.
C) PUSPC.
D) PCa.
Correct Answer:
Verified
Q10: Armand buys a 10-year, $10,000 bond that
Q11: A major advantage that municipal bonds have
Q12: Harper just got a big raise at
Q13: Sarah is considering the purchase of a
Q14: Carlos is considering buying either a corporate
Q16: Emily is in the 10% marginal income
Q17: The risk that a bond issuer will
Q18: Consider the figure below, which shows the
Q19: The advantage of municipal bonds over corporate
Q20: According to the pure expectations theory, a
Unlock this Answer For Free Now!
View this answer and more for free by performing one of the following actions

Scan the QR code to install the App and get 2 free unlocks

Unlock quizzes for free by uploading documents