Figure 5-1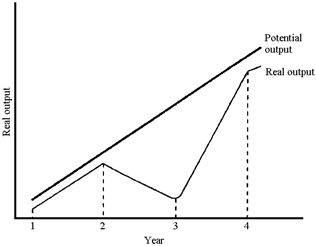
Figure 5-1 plots potential and real output for a hypothetical economy. Based on this graph, the recession occurred
A) between years 1 and 2.
B) between years 2 and 3.
C) between years 3 and 4.
D) after year 4.
Correct Answer:
Verified
Q121: During the Great Depression of the 1930s,
Q128: Large sport utility vehicles (SUVs) add significantly
Q129: In the past 100 years, the U.S.economy
Q131: Stabilization policy describes
A)government programs designed to prevent
Q133: When people smoke cigarettes, their friends and
Q135: International per capita GDP comparisons are misleading
Unlock this Answer For Free Now!
View this answer and more for free by performing one of the following actions

Scan the QR code to install the App and get 2 free unlocks

Unlock quizzes for free by uploading documents