Aggregate demand and supply curves have been widely used to analyze the performance of the macroeconomy. Figure 5-3 shows four diagrams that represent different changes in the macroeconomy. Choose the diagram that best represents the situations described in the following questions. Figure 5-3 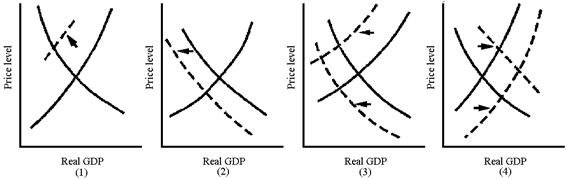
Which graph in Figure 5-3 best represents the aggregate demand-induced Great Depression of the 1930s?
A) 1
B) 2
C) 3
D) 4
Correct Answer:
Verified
Q165: Stagflation can be defined as a combination
Q186: In contrast to the post-World War II
Q187: Aggregate demand and supply curves have been
Q188: What makes the macroeconomic performance of the
Unlock this Answer For Free Now!
View this answer and more for free by performing one of the following actions

Scan the QR code to install the App and get 2 free unlocks

Unlock quizzes for free by uploading documents