Multiple Choice
Figure 11-3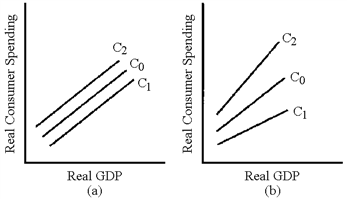
In Figure 11-3, which line represents the change in the consumption schedule caused by a cut in fixed taxes?
A) C1 in graph (a)
B) C2 in graph (a)
C) C1 in graph (b)
D) C2 in graph (b)
Correct Answer:
Verified
Related Questions
Q184: Table 11-1 Q188: Why does the numerical value of the Q191: In the short run, tax cuts that Q193: Which of the following factors has the Q195: Explain why a change in income tax Q196: Define the following terms and explain their![]()
Unlock this Answer For Free Now!
View this answer and more for free by performing one of the following actions

Scan the QR code to install the App and get 2 free unlocks

Unlock quizzes for free by uploading documents