Multiple Choice
Figure 19-2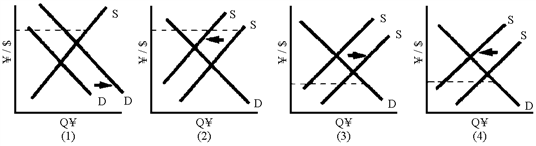
Of the graphs in Figure 19-2, which one shows the effect of an increase in interest rates in Japan?
A) 1
B) 2
C) 3
D) 4
Correct Answer:
Verified
Related Questions
Q142: Under the gold standard,
A)each nation had discretion
Q144: A country, such as Argentina in 2002,
Q162: To try and stave off a devaluation
Q163: A country with an overvalued currency
A)will have
Q169: Adhering to a strict fixed exchange rate
Unlock this Answer For Free Now!
View this answer and more for free by performing one of the following actions

Scan the QR code to install the App and get 2 free unlocks

Unlock quizzes for free by uploading documents