Multiple Choice
Figure 8-1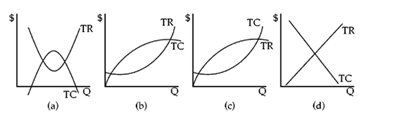
Which graph in Figure 8-1 shows a typical firm's total revenue and total cost curves?
A) (a)
B) (b)
C) (c)
D) (d)
Correct Answer:
Verified
Related Questions
Q101: Company A manufactures a single automotive component.It
Q103: The difference between economic profit and accountant's
Q105: Marginal revenue is the addition to a
Q106: Sally leaves her $24,000 secretarial position with
Q111: The demand curve facing a firm is
Unlock this Answer For Free Now!
View this answer and more for free by performing one of the following actions

Scan the QR code to install the App and get 2 free unlocks

Unlock quizzes for free by uploading documents