Figure 9-1 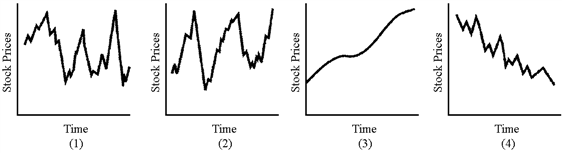
Which of the graphs in Figure 9-1 best illustrates the path of a composite of common stock prices over the long term?
A) (1)
B) (2)
C) (3)
D) (4)
Correct Answer:
Verified
Q201: Define the following terms and explain their
Q201: Why are bonds risky to a corporation?
Q205: From the viewpoint of the individual investor,
Q207: Corporate income is taxed twice-once in the
Q209: An investor is trying to decide whether
Q211: For some investors, derivatives can be attractive
Q212: Assume Jean-Claude purchased real estate for $500,000
Q216: If stocks are riskier than bonds, why
Q217: How is it possible to have a
Q220: What most frightens investors in the stock
Unlock this Answer For Free Now!
View this answer and more for free by performing one of the following actions

Scan the QR code to install the App and get 2 free unlocks

Unlock quizzes for free by uploading documents