Use the table below to choose the correct answer.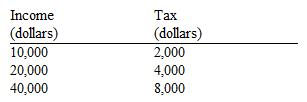
The tax schedule shown here is
A) regressive.
B) proportional.
C) progressive.
D) proportional up to $20,000 and regressive beyond that.
Correct Answer:
Verified
Q108: In the supply and demand model, a
Q149: The Laffer curve illustrates the relationship between
A)
Q157: Which of the following examples illustrates a
Q160: According to the Laffer curve,
A) an increase
Q162: When the top marginal tax rates were
Q167: Approximately 50,000 luxury boats (priced $100,000 or
Q169: Suppose the federal excise tax rate on
Q174: About 35,000 general aviation multiengine airplanes are
Q174: Use the table below to choose the
Q177: Data from the effects of the substantial
Unlock this Answer For Free Now!
View this answer and more for free by performing one of the following actions

Scan the QR code to install the App and get 2 free unlocks

Unlock quizzes for free by uploading documents