Multiple Choice
Figure 7-17 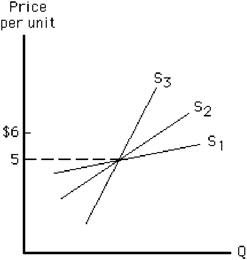
Consider Figure 7-17. Between the prices of $5 and $6, which supply curve is most elastic and which is least elastic?
A) S1 is most elastic; S2 is least elastic.
B) S1 is most elastic; S3 is least elastic.
C) S3 is most elastic; S1 is least elastic.
D) S3 is most elastic; S2 is least elastic.
E) S2 is most elastic; S3 is least elastic.
Correct Answer:
Verified
Related Questions

