Exhibit 2-2 Production possibilities curve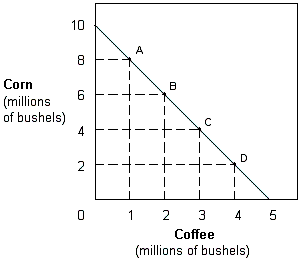
-In Exhibit 2-2, the opportunity cost of coffee when moving from A to B is:
A) 2 million bushels of corn.
B) 6 million bushels of corn.
C) 8 million bushels of corn.
D) 14 million bushels of corn.
Correct Answer:
Verified
Q33: Exhibit 2-2 Production possibilities curve Q34: Exhibit 2-15 Production possibilities curve Q35: When deciding whether to buy a second Q36: While waiting in line to buy two Q37: A local restaurant offers an "all you Q39: According to marginal analysis, you should choose Q40: Why are all costs really "opportunity costs"? Q41: A production possibility graph slopes down because Q42: Using a production possibilities curve, a technological Q43: A production possibilities curve has "good X"![]()
![]()
Unlock this Answer For Free Now!
View this answer and more for free by performing one of the following actions

Scan the QR code to install the App and get 2 free unlocks

Unlock quizzes for free by uploading documents