Exhibit 2-19 Production possibilities curves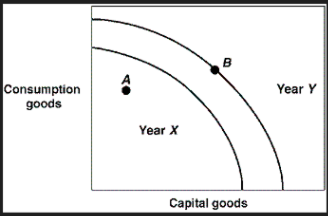
In Exhibit 2-19, the production possibilities curves for a country are shown for the years Year X and Year Y. Suppose this country was located at point A in Year X and would like to get to point B in Year Y. Construct a plan this country to activate in Year X to achieve this growth.
A) Eliminate unemployment, improve production technology, and acquire additional resources.
B) Produce more consumption goods, eliminate unemployment, and reduce inefficiency.
C) Reduce inefficiency, shift energy sources, and hold technology fixed.
D) It is impossible for this country to achieve point B in Year Y.
Correct Answer:
Verified
Q80: When the opportunity cost of producing carrots
Q81: An analysis of production possibilities curves indicates
Q82: Economic growth may be represented by a(n):
A)
Q83: Compare two economies A and B that
Q86: Exhibit 2-18 Production possibilities curves Q87: What can a nation do to increase Q88: Adding more resources causes: Q89: If an economy keeps increasing its capital Q90: Technological innovations will cause: Q145: With time, which one of the following![]()
A) downward movement along
A) the production possibilities
Unlock this Answer For Free Now!
View this answer and more for free by performing one of the following actions

Scan the QR code to install the App and get 2 free unlocks

Unlock quizzes for free by uploading documents