Exhibit 4-3 Supply and demand curves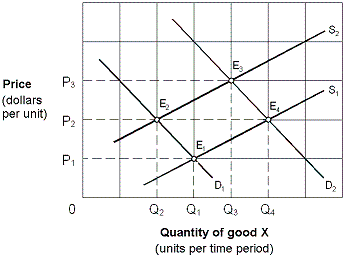
The market shown in Exhibit 4-3 is initially in equilibrium at E4. Changes in market conditions result in a new equilibrium at E3. This change is stated as a(n) :
A) increase in supply and an increase in quantity demanded.
B) increase in supply and a decrease in demand.
C) decrease in supply and a decrease in quantity demanded.
D) increase in demand an increase in supply.
Correct Answer:
Verified
Q17: Over a ten year period, the monthly
Q19: Exhibit 4-2 Supply and demand curves
Q20: Exhibit 4-2 Supply and demand curves
Q21: Suppose prices for new homes have risen,
Q23: Exhibit 4-3 Supply and demand curves
Q24: Exhibit 4-6 Demand and supply curves
Q25: Exhibit 4-3 Supply and demand curves
Q26: Suppose the market for "soda X" is
Q27: Exhibit 4-3 Supply and demand curves
Q194: How would a decrease in the price
Unlock this Answer For Free Now!
View this answer and more for free by performing one of the following actions

Scan the QR code to install the App and get 2 free unlocks

Unlock quizzes for free by uploading documents