Exhibit 4-8 Demand and supply curves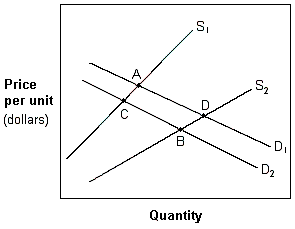
In Exhibit 4-8, a movement from A to B in which price has decreased and quantity has increased is best explained by a(n) :
A) increase in supply and demand.
B) decrease in supply and demand.
C) increase in supply that dominates a decrease in demand.
D) increase in demand that dominates a decrease supply.
Correct Answer:
Verified
Q54: Exhibit 4-8 Demand and supply curves
Q55: Price ceilings set below the equilibrium create:
A)
Q56:

