TIMSS: The graph below shows the number of pens, pencils, rulers, and erasers sold by a store in one week.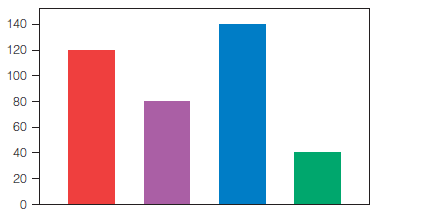
The names of the items are missing from the graph. Pens were the item most often sold, and fewer erasers than any other items were sold. More pencils than rulers were sold. How many pencils were sold?
A) 40 pencils
B) 80 pencils
C) 120 pencils
D) 140 pencils
Correct Answer:
Verified
Q16: Circle graphs are used to illustrate:
A)categorical data.
B)numerical
Q17: A line graph could be used in
Q18: The following are true statements about box-and-whisker
Q19: A box-and-whisker plots graphically displays:
A)the mean, the
Q20: Which of the following is not a
Q22: Data collection is more meaningful for younger
Q23: NAEP: The pie chart below shows the
Q24: All of the following data values are
Q25: In order to determine the average price
Q26: 34. What are the major concepts about
Unlock this Answer For Free Now!
View this answer and more for free by performing one of the following actions

Scan the QR code to install the App and get 2 free unlocks

Unlock quizzes for free by uploading documents