A TV reporter showed this graph during a newscast and said: "The graph shows that there is a huge increase in the number of robberies from 2016 to 2017."
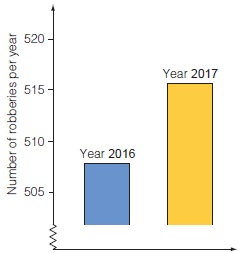
Do you consider the reporter's statement to be a reasonable interpretation of the graph? Give an explanation to support your answer.
Correct Answer:
Verified
Q33: In order to find the class average
Q34: Find the median of the following set:
{7,
Q35: What are two misconceptions children are prone
Q36: Children have difficulty deciding when the mode,
Q37: Explain the difference between categorical and numerical
Q38: Using tables is one of the first
Q39: Children use circle graphs:
A)only after they can
Q40: Young children would work with graphs in
Q41: Is it possible to create stem-and-leaf plots
Q43: Circle graphs are difficult for children to
Unlock this Answer For Free Now!
View this answer and more for free by performing one of the following actions

Scan the QR code to install the App and get 2 free unlocks

Unlock quizzes for free by uploading documents