Exhibit 10-7 Income distribution for three countries 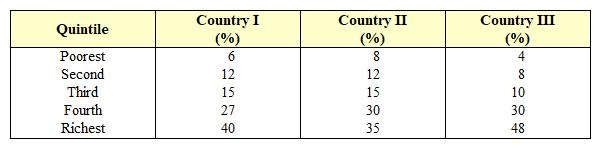 Exhibit 10-7 shows the percentage of income received by each population quintile. From this chart we can conclude:
A) Country I has the most unequal income distribution.
B) Country III has the most equal income distribution.
C) Country II has the most unequal income distribution.
D) Country II has the most equal income distribution.
E) Country III has a more equal income distribution than Country II.
Correct Answer:
Verified
Q18: In the United States, approximately what percentage
Q20: The poorest 20 percent of the U.S.
Q42: Which of the following is not included
Q48: Of the following demographic groups, which has
Q48: Of the following demographic groups, which has
Q52: Which of the following is not an
Q55: The official poverty line is defined as:
A)
Q59: The official poverty rate for all persons
Q110: Which of the following are not counted
Q110: Which of the following are not counted
Unlock this Answer For Free Now!
View this answer and more for free by performing one of the following actions

Scan the QR code to install the App and get 2 free unlocks

Unlock quizzes for free by uploading documents