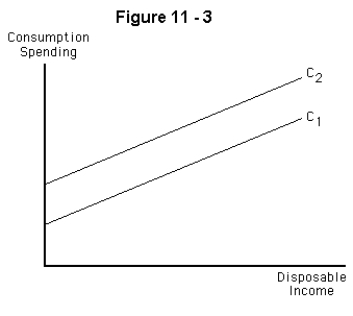
-Refer to Figure 11-3.Which of the following could explain the shift from C₁ to C₂?
A) An increase in disposable income
B) An increase in net taxes that increases the marginal propensity to consume
C) A decrease in net taxes that increases the marginal propensity to consume
D) An increase in net taxes that increases autonomous consumption spending
E) A decrease in net taxes that increases autonomous consumption spending.
Correct Answer:
Verified
Q49: If net taxes decrease,which of the following
Q50: If the interest rate increased,which of the
Q51: An upward shift of the consumption function
Q52: At each level of income,net taxes reduce
Q53: A movement along the consumption-function line would
Q55: The slope of the consumption function can
Q56: If net taxes decrease by $500 billion,both
Q57: Use the table below to determine the
Q58: Which of the following is not another
Q59: Which of the following statements is true?
A)
Unlock this Answer For Free Now!
View this answer and more for free by performing one of the following actions

Scan the QR code to install the App and get 2 free unlocks

Unlock quizzes for free by uploading documents