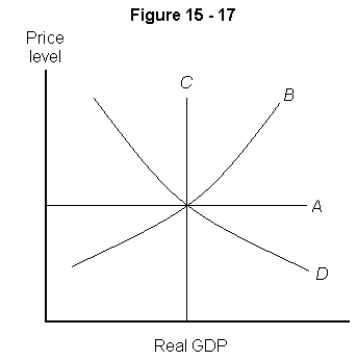
-In Figure 15-17 above,which of the following most likely represents the long-run aggregate supply curve?
A) A
B) B
C) C
D) D
E) None of the above.
Correct Answer:
Verified
Q171: The aggregate supply curve is
A) the sum
Q172: Q173: Which of the following would lead to Q174: If the government increases taxes,which of the Q175: A positive demand shock will Q177: If there is a positive demand shock,which Q178: According the AS/AD model,in the long run,expansionary Q179: Stagflation is caused by Q180: The economy's long run aggregate supply curve Q181: The phenomenon of wages in many industries![]()
A) shift the
A) a negative supply
A)
Unlock this Answer For Free Now!
View this answer and more for free by performing one of the following actions

Scan the QR code to install the App and get 2 free unlocks

Unlock quizzes for free by uploading documents