The table shows soybean production, in millions of tons, in Brazil's Cerrados region, as a function of the cultivated area, in millions of acres. Use technology to obtain the regression line. Round coefficients to two decimal places. 
A) 
B) 
C) 
D) 
E) 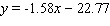
Correct Answer:
Verified
Q90: The chart shows second quarter total retail
Q91: Find the best-fit line associated with the
Q92: Find the linear equation that is the
Q93: Find the best-fit line associated with the
Q94: Find the linear equation that is the
Q95: Use correlation coefficients to determine which of
Q96: Find the best-fit line associated with the
Q97: Decide which of the two given functions
Q98: Find the linear equation that is the
Q100: Following are approximate values of the Amex
Unlock this Answer For Free Now!
View this answer and more for free by performing one of the following actions

Scan the QR code to install the App and get 2 free unlocks

Unlock quizzes for free by uploading documents