The following chart shows the value of trade between two countries for the period 1994-2004 (  represents 1994) .
 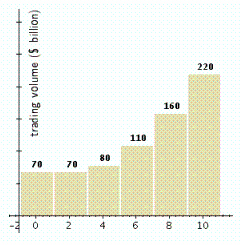 Which of the following models best approximates the data given? (Try to answer this without actually computing values.)
A) 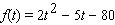
B) 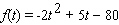
C) 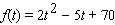
D) 
E) 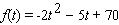
Correct Answer:
Verified
Q7: Choose the correct letter for each question.
Q8: For the following demand equation, express the
Q9: Pack-Em-In Real Estate is building a new
Q10: The market research department of the Better
Q11: For the following demand equation, find the
Q13: For the following demand equation, find the
Q14: You are the sales manager for Montevideo
Q15: The fuel efficiency (in miles per gallon)of
Q16: Find the y -intercept(s)of the graph of
Q17: The two fraternities Sigma Alpha Mu and
Unlock this Answer For Free Now!
View this answer and more for free by performing one of the following actions

Scan the QR code to install the App and get 2 free unlocks

Unlock quizzes for free by uploading documents