The graph in the following illustration shows the depths of a submarine at certain times. 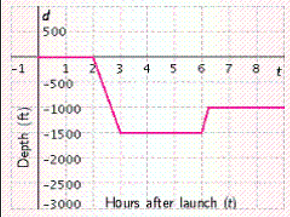 How large an ascent does the sub begin to make 6 hours after launch?
__________ feet
Correct Answer:
Verified
Q18: The graph in the following illustration shows
Q19: Give the coordinates of the point G
Q20: Plot the point on the rectangular
Q21: The point (2,5) is located
A) two units
Q22: Find the midpoint of the line segment
Q24: If a point is midway between two
Q25: The point (0, 0) is the _.
Q26: If (-1,3) is the midpoint of segment
Q27: Plot (-2,0) on a rectangular coordinate system
Q28: In which quadrant is the point (-2,-3)
Unlock this Answer For Free Now!
View this answer and more for free by performing one of the following actions

Scan the QR code to install the App and get 2 free unlocks

Unlock quizzes for free by uploading documents