Use the data in the table to make a line graph showing the average acreage (in acres) of U.S. farms for the years 1950 through 1990.
A) 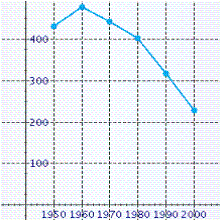
B) 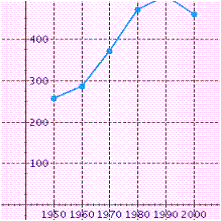
C) 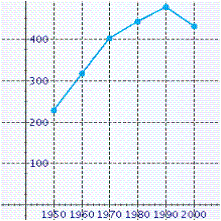
D) 
E) 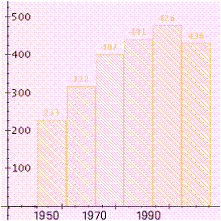
Correct Answer:
Verified
Q5: Which of the following illustrations is a
Q6: Raul has an adjusted income of $153,850,
Q7: Use the data in the table
Q9: Which of the following illustrations is a
Q10: Refer to the pie graph that shows
Q11: Which of the following illustrations is a
Q12: Which of the following illustrations best represents
Q13: Which of the following illustrations represents a
Q20: How many more pet cats are there
Q27: Find the mean of the list of
Unlock this Answer For Free Now!
View this answer and more for free by performing one of the following actions

Scan the QR code to install the App and get 2 free unlocks

Unlock quizzes for free by uploading documents