A graph was created comparing the number of hours students spent studying and their score on the final exam.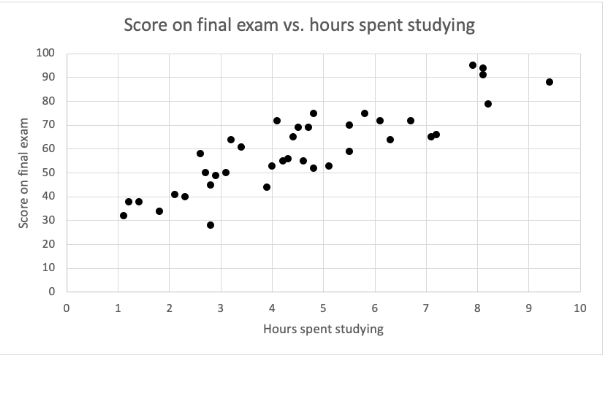 Which of the following describes the trend?
A) As the study time increases, the grade on the final exam decreases
B) As study time decreases, the grade on the final exam increases
C) None of these answers are correct.
D) As the study time decreases, the grade on the final exam decreases
Correct Answer:
Verified
Q237: A theme park records the group sizes
Q238: 100 people in each age bracket were
Q239: A bug was flying at a constant
Q240: A dice is suspected of being unfair.
Q241: A graph was made comparing the age
Q243: A businesswoman needs to fly to Bulgaria
Q244: A businesswoman needs to fly to Bulgaria
Q245: A businesswoman needs to fly to Bulgaria
Q246: The graph below shows the relationship between
Q247: A researcher is using this data that
Unlock this Answer For Free Now!
View this answer and more for free by performing one of the following actions

Scan the QR code to install the App and get 2 free unlocks

Unlock quizzes for free by uploading documents