Multiple Choice
A population of rabbits was tracked over a 55-day period. The data is shown in the following graph. What was the minimum number of rabbits during this time? 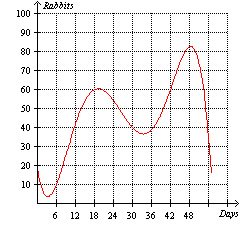
A) 20
B) 37
C) 83
D) 5
E) 15
Correct Answer:
Verified
Related Questions
Q68: A membership to a local fitness club
Q69: The amount of an investment A after
Q70: The resistance R of a wire (in
Q71: Given the table below is the variable
Q72: Does the equation x = ( y
Q74: Which of the following formulas express the
Unlock this Answer For Free Now!
View this answer and more for free by performing one of the following actions

Scan the QR code to install the App and get 2 free unlocks

Unlock quizzes for free by uploading documents