Multiple Choice
A population of rabbits was tracked over a 55-day period. The data is shown in the following graph. What was the approximate number of rabbits on day 30? 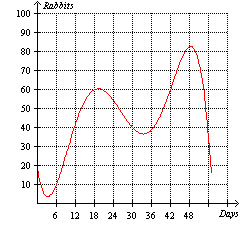
A) 40
B) 15
C) 10
D) 30
E) 83
Correct Answer:
Verified
Related Questions
Q61: Find a function that models the area

