A patient was administered Iodine-123 before a thyroid imaging scan. The table illustrates the data gathered over a 12-hour time period.
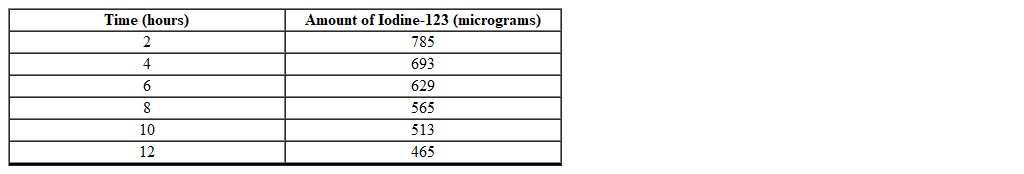 Using a graphing calculator find an appropriate curve that models the amount of Iodine-123 (in micrograms) as a function of the time (in hours) (round to the nearest thousandth).
Correct Answer:
Verified
Q110: Which one of the following functions is
Q111: After college graduation Sheena was offered two
Q112: After college graduation Sheena was offered two
Q113: The number of people infected with the
Q114: The data table represents hours you work
Q116: Which one of the following functions is
Q117: The data table represents hours you work
Q118: After college graduation Sheena was offered two
Q119: The graph of every equation is a
Q120: The data table represents hours you work
Unlock this Answer For Free Now!
View this answer and more for free by performing one of the following actions

Scan the QR code to install the App and get 2 free unlocks

Unlock quizzes for free by uploading documents