Multiple Choice
Which one of the following graphs represents the function  ?
?
A) 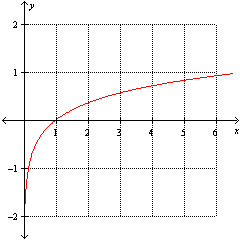
B) 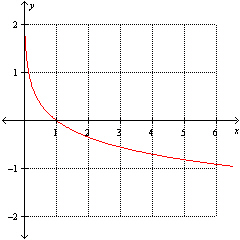
C) 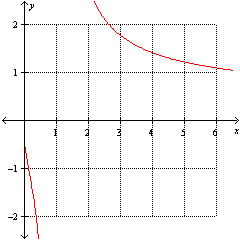
D) None of these options
E) 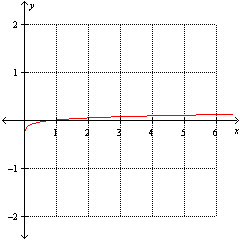
Correct Answer:
Verified
Related Questions
Q35: If the hydrogen ion concentration of a
Q36: If we know the amount of light
Q37: For the exponential model Q38: The pH of tomatoes is normally in Q39: On August 18 2009 a 6.3 magnitude Q41: Solve the exponential equation Q42: If $49000 is invested at an interest Q43: Solve the logarithmic equation Q44: The number of bees in a certain Q45: Solve the logarithmic equation Unlock this Answer For Free Now! View this answer and more for free by performing one of the following actions Scan the QR code to install the App and get 2 free unlocks Unlock quizzes for free by uploading documents![]()
![]()
![]()
![]()

