During the years 1994 to 2007 seat belt use among front seat passengers ages 16 to 24 has increased. A linear model for the percentage of these passengers who use a seat belt is 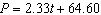 where P is percentage with a seat belt and t is years since 2000. The years before 2000 have a negative value for t. What is the vertical intercept of the model and what does it mean in terms of the problem?
A)  . In the year 1994 seat belt use was 64.60.
B)  . In the year 2000 seat belt use was 64.60.
C) 2.33. Every year seat belt use goes up 2.33%
D)  . In the year 2000 seat belt use was 64.60%.
Correct Answer:
Verified
Q15: During the years 1994 to 2007 seat
Q16: The percentage of eighth grade students P
Q17: The percentage of eighth grade students P
Q18: During the years 1994 to 2007 seat
Q19: The percentage of eighth grade students P
Q21: The percentage P of 6 to 11
Q22: Given the data set draw a scatterplot.
Q23: Given the data set draw a scatterplot.
Q24: The percentage P of 6 to 11
Q25: During the years 2002 to 2008 smoking
Unlock this Answer For Free Now!
View this answer and more for free by performing one of the following actions

Scan the QR code to install the App and get 2 free unlocks

Unlock quizzes for free by uploading documents